Electricity for for Economists III
Introduction to the institutions in Peru related to Electricity
 Electricity
Finally, we arrive at the third part of this series of blog posts introducing the electricity sector for economists. This time, we will explore how to automate the downloading and processing of electricity data to use it in our prediction models. As mentioned in previous posts, electricity information is useful due to its high correlation with GDP and its quick and easy accessibility.
Processing
The processing of COES data is done through web scraping: a technique used to extract data from web pages using software. Various techniques and software can be employed, but we will use the R software and HTML code to download the data.
If you want to review the information available on the COES website, you can do so here.
HTTP: GET and POST
To download information from the COES website (https://www.coes.org.pe/portal/), we will use HTML code. HTML is a markup language used for creating web pages. It contains the “instructions” that a web browser (such as Chrome) uses to display and interact with the web page.
For data downloads, two primary methods of data transfer in HTTP are commonly used: GET and POST.
GET: A method in the HTTP protocol used to retrieve information from a server. It sends a request to obtain a response (e.g., an Excel file or other data we want to download) for the client (web page). GET transmits the data in a “visible” way through the web browser’s URL. For example, suppose we want to request information from a hypothetical website, www.luis.com, and the required data for the request are the file name and month:
name = luisandmonth = November. Using GET, the request would look like: www.luis.com/download?name=luis&month=november. Here, the bold part is referred to as the query. By submitting this request to the server (with our data), we would receive a response (e.g., an Excel file). Each website has its own syntax for submitting requests.POST: Another method in the HTTP protocol that, unlike GET, sends information to the server for processing and updates the server. For example, when we submit (request) data through a form, the server processes the data and, after a redirect, returns (response) a page with information. To download a file using the POST method, a query is sent in a manner similar to GET. However, instead of immediately receiving a response, the server opens a temporary link at another URL for the file download.
Next, we will see a practical application of these terms to download relevant information from the COES website.
COES: Indicators of the Peruvian Energy Sector
To access this section, we go to the Indicators Portal on the COES website. By clicking on export, we send a query containing the selected date range in the request, receiving in return a response with an Excel file containing the data. How can we determine if the method is POST or GET? It’s easy, by using a web analysis tool such as the Chrome Developer Tools.
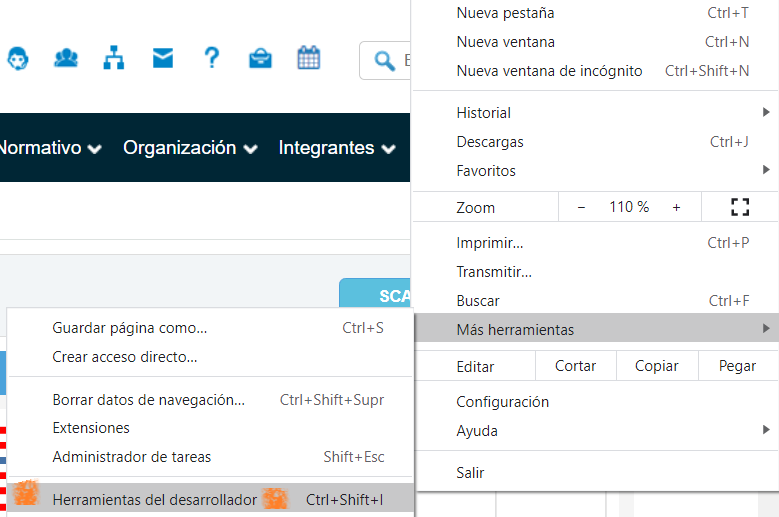
Figure 1: Figure 1
Clicking on the tools will display various options, with Network being the most relevant for us right now. By clicking on Network, we can observe the interactions between our client (web page) and the COES server. To clean up the workspace, first click Clear, which clears the window and helps focus on future interactions. Next, click on the Export button on the COES webpage (after selecting the date range) to download the Excel file. In the Network area, two interactions appear: having two interactions suggests that the method might be POST (one URL for sending and another for downloading).
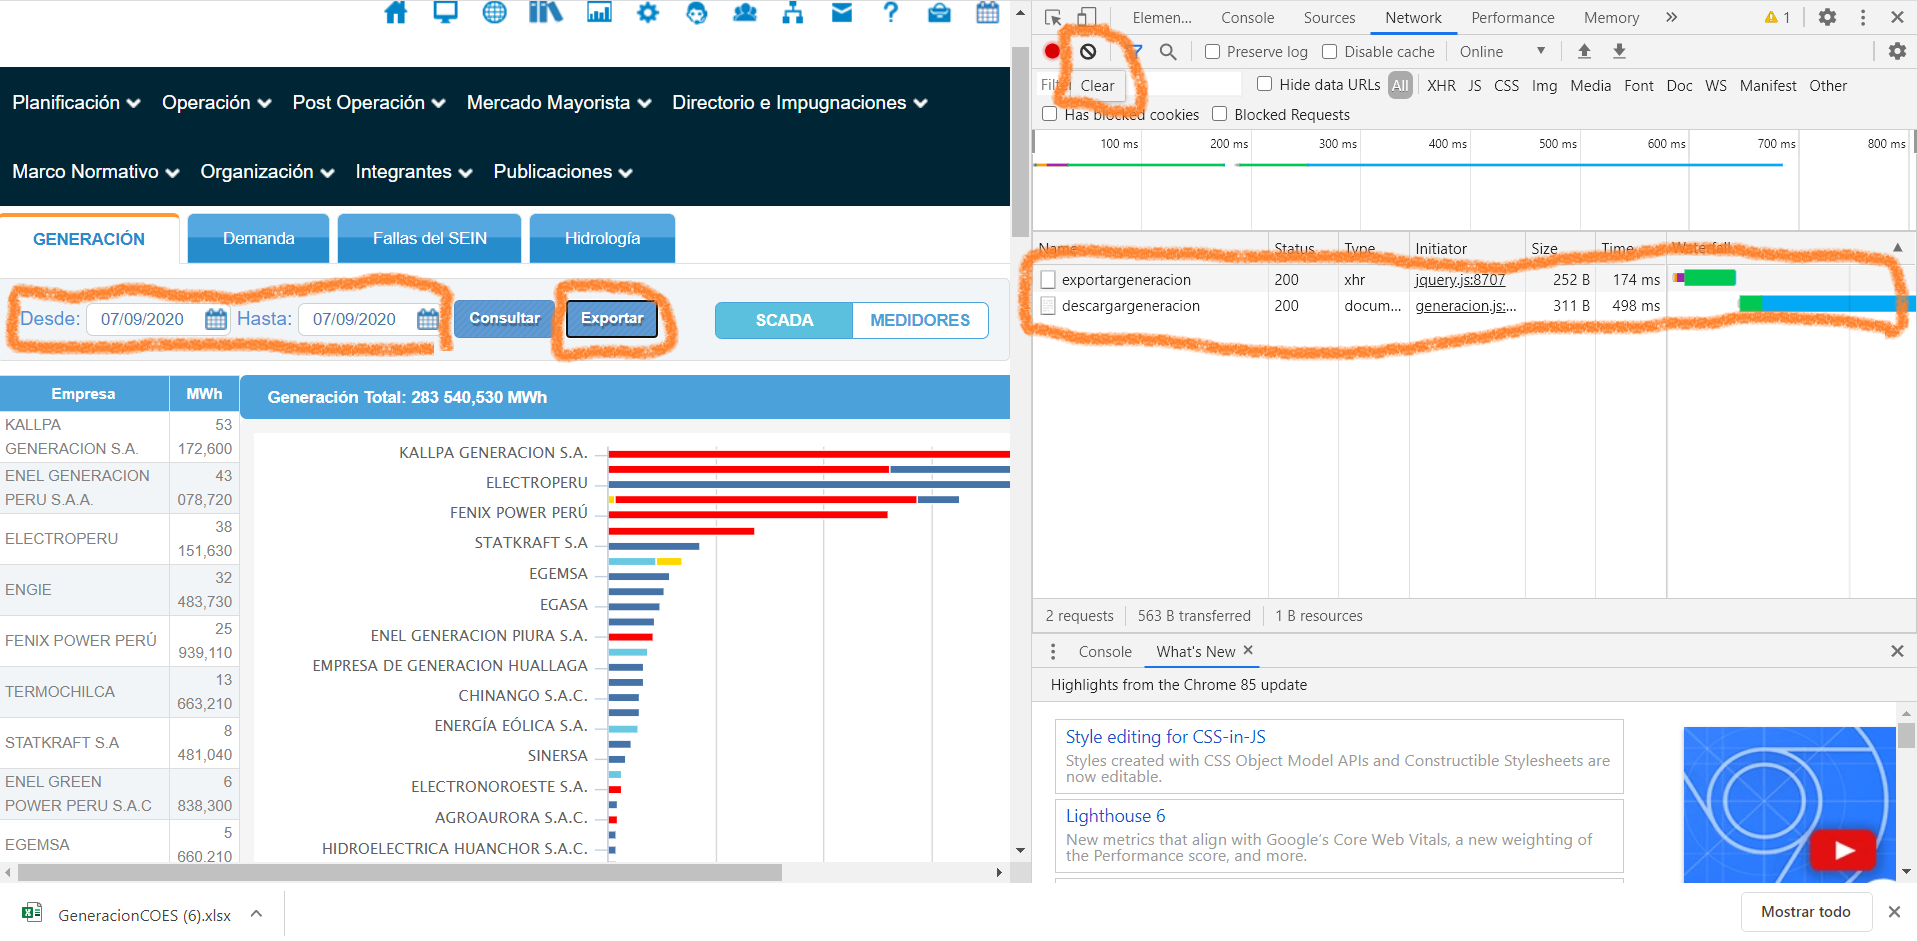
Figure 2: Figure 2
Click on the first interaction (exportargeneracion) to gather more information. Since it’s the first interaction, it should contain the request sent to the server.
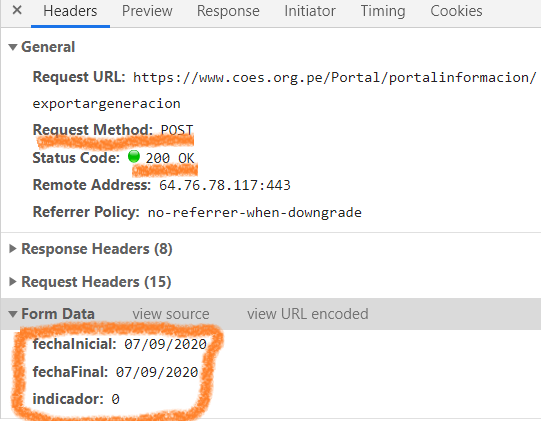
Figure 3: Figure 3
We can see that the Request Method is indeed POST. Additionally, the request URL is shown as “https://www.coes.org.pe/Portal/portalinformacion/exportargeneracion". Finally, we see that three data elements are sent in the request: the start date (fechaInicial), the end date (fechaFinal), and an indicator (indicador).
It’s important to note the date format: day/month/year, where both the day and the month always have two digits. This format is crucial when sending the request.
A header acts as metadata (additional descriptive information, though not intrinsic to the request) that accompanies the request. In the image, there are 15 request headers. While it’s not mandatory to use them, they can be helpful, as we will see later.
Finally, the Status Code = 200 indicates that the interaction was successful.
Thus, we can conclude that the method used to obtain this information was POST, with the requested date range included in the request.
However, since it’s a POST method, the request will not immediately provide a response. We need to check the second interaction to find out from which URL to download the data.
To do so, click on the second interaction (descargargeneracion) to access the following information:
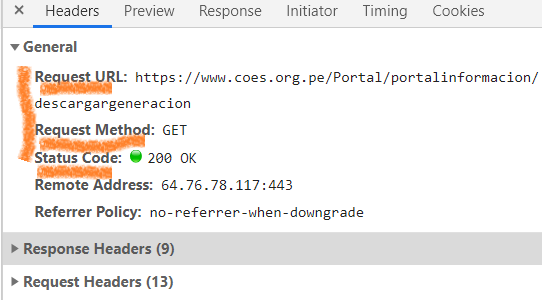
Figure 4: Figure 4
Here, we can see that an “access gateway” to the data was opened at the URL: “https://www.coes.org.pe/Portal/portalinformacion/descargargeneracion". This interaction uses a GET method, meaning that by entering the URL, the server will automatically provide the data. Since the request data was already entered in the previous interaction, no additional data or query is needed.
Downloading in R
After analyzing the steps for downloading the files, we will now automate this process using R code. This will allow us to access the data directly through our code, enabling us to process it afterward.
First, R requires a special package to handle HTTPS methods, called httr. This package provides access to two essential functions, GET and POST, for downloading data. To install it, simply type install.packages(“httr”) once in the RStudio console.
After installing it, we invoke the library and use the POST method to download the file. Remember that the POST method requires two steps for file downloads: first, a POST request to send the data, and then a GET request to download the file from the temporary link that was opened. To download and read the data using the GET method, I will use the read.xlsx function from the openxlsx library, which allows downloading from a URL and reading an Excel file if contained within.
Since the link is temporary, the two functions must be executed sequentially. Below, I will explain these steps:
library(httr)
library(openxlsx)

fechaInicial = "07/09/2020"
fechaFinal = "07/09/2020"
POST(url = as.character("https://www.coes.org.pe/Portal/portalinformacion/exportargeneracion"), config(ssl_verifypeer = FALSE), add_headers("Referer"= "http://www.coes.org.pe/Portal/portalinformacion/generacion"),
               body = list( "fechaInicial" = fechaInicial,
                            "fechaFinal"= fechaFinal,
                            "indicador"= 0)) ##Función POST envío los datos
## Response [https://www.coes.org.pe/Portal/portalinformacion/exportargeneracion]
##   Date: 2024-11-23 19:28
##   Status: 200
##   Content-Type: application/json; charset=utf-8
##   Size: 1 B
datos = read.xlsx("https://www.coes.org.pe/Portal/portalinformacion/descargargeneracion",sheet = 1,detectDates = TRUE) ##Funcion GET descargo los datos

datos[1:5,] #ejemplo de 5 primeras filas
##        FECHA                           EMPRESA GRUPO/CENTRAL TIPO.GENERACIÓN
## 1 07/09/2020         AGRO INDUSTRIAL PARAMONGA     PARAMONGA  TERMOELÉCTRICA
## 2 07/09/2020                 AGROAURORA S.A.C.         MAPLE  TERMOELÉCTRICA
## 3 07/09/2020 AGROINDUSTRIAS SAN JACINTO S.A.A.   SAN_JACINTO  TERMOELÉCTRICA
## 4 07/09/2020              AGUAS Y ENERGIA PERU         PIAS1  HIDROELÉCTRICA
## 5 07/09/2020               ANDEAN POWER S.A.C.       CARHUAC  HIDROELÉCTRICA
##    TOTAL
## 1 362.45
## 2 420.40
## 3 191.80
## 4 107.65
## 5 271.95
- POST: The function uses the POST method, sending a request to the URL “https://www.coes.org.pe/Portal/portalinformacion/exportargeneracion", requesting the database we need between the dates fechaInicial (“07/09/2020”) and fechaFinal (“07/09/2020”). The query can be added in the body section as a list since there are multiple parameters. Finally, the indicator (“0”) seems to be a formality without any functionality. Note that we include the header “Referer”.
If the response in the console displays Status: 200, the request was successful. If this number does not appear, it means there was an error, and you should check the Chrome Developer Tools to ensure the parameters have not changed (parameters often change a couple of times per year).
The following are additional parameters, which are not mandatory but can help avoid errors:
A header acts as metadata (additional descriptive information, though not intrinsic to the request) included in the request. In this case, the header Referer refers to the page from which we redirected to the specified URL. If we were using a web browser, we would make the request from “http://www.coes.org.pe/Portal/portalinformacion/generacion” (Indicators Portal - Generation). While it is not necessary to include this, it informs the server that we accessed the data through a legitimate entry point and are not hackers attempting to overload their website or access unauthorized pages. Some websites have stricter security measures, while others are more lenient.
Finally, SSL Verifier refers to whether the website has anti-scam protection (e.g., preventing credit card numbers from being stolen). It is not mandatory to tell the function to ignore this, but we explicitly set it to FALSE just in case.
- read.xlsx: The first parameter specifies the URL containing our Excel file. Since we performed the POST function earlier, the URL “https://www.coes.org.pe/Portal/portalinformacion/descargargeneracion" opened a temporary link where the requested Excel file is located. Sheet = 1 indicates which sheet of the Excel file to read. Finally, detectDates = TRUE ensures that Excel date formats are converted into standard date formats.
Processing in R
I will use the Tidyverse library, which provides several tools for data manipulation.
library(tidyverse)
To get an overview of the data:
glimpse(datos)
## Rows: 111
## Columns: 5
## $ FECHA           <chr> "07/09/2020", "07/09/2020", "07/09/2020", "07/09/2020"…
## $ EMPRESA         <chr> "AGRO INDUSTRIAL PARAMONGA", "AGROAURORA S.A.C.", "AGR…
## $ `GRUPO/CENTRAL` <chr> "PARAMONGA", "MAPLE", "SAN_JACINTO", "PIAS1", "CARHUAC…
## $ TIPO.GENERACIÓN <chr> "TERMOELÉCTRICA", "TERMOELÉCTRICA", "TERMOELÉCTRICA", …
## $ TOTAL           <dbl> 362.45, 420.40, 191.80, 107.65, 271.95, 6.15, 242.40, …
The downloaded data contains five columns: Fecha (Date), Empresa (Company), Grupo (Group), Tipo de Generación (Type of Generation), and Total (MWh).
Typically, we only need to retain the Fecha and Total columns. However, the additional information can be useful for analysts (e.g., identifying generation from agricultural companies to infer sector activity or comparing gas, solar, and other types of generation).
Additionally, we might have downloaded data for a date range greater than one day. To aggregate total generation by day, we group the data by FECHA. Finally, we sum the values by day and convert MWh to GWh by dividing by 1,000.
datos %>% # Access the data
  select(FECHA, TOTAL) %>% # Select Date and Total (MWh)
  group_by(FECHA) %>% # Group by day
  summarise(GWh = sum(TOTAL, na.rm = FALSE) / 1000) %>% # Sum and convert to GWh
  ungroup() # Ungroup (optional)
## # A tibble: 1 × 2
##   FECHA        GWh
##   <chr>      <dbl>
## 1 07/09/2020  141.
This gives us daily data in GWh. The next step would be adding the data to a historical database. We won’t delve into that here but will instead move on to the next topic: IEOD.
COES: IEOD
Similar to the Indicators of the Peruvian Energy Sector, we first need to access the IEOD platform and check whether the download function uses POST or GET.
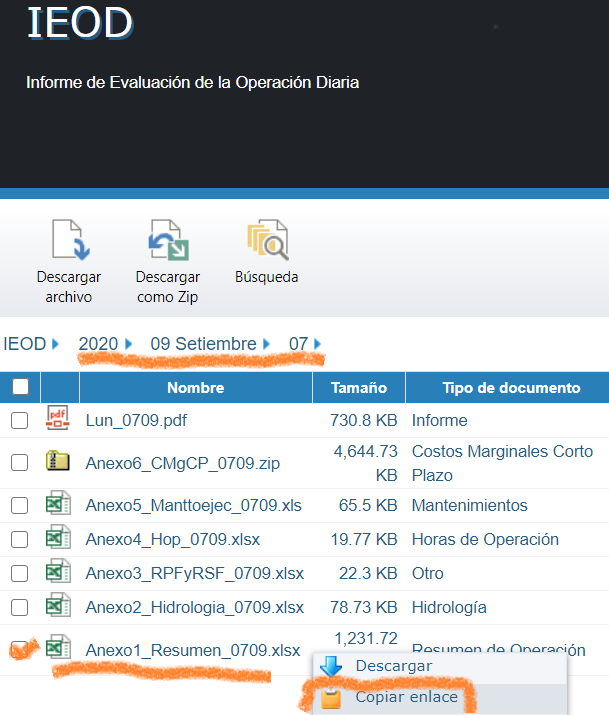
Figure 5: Figure 1
On the IEOD platform, select a date and the desired Excel file (e.g., “Anexo1_Resumen_0709.xlsx"). By right-clicking on the link, you can copy the URL address.
In this case, the copied address is: “https://www.coes.org.pe/portal/browser/download?url=Post%20Operaci%C3%B3n%2FReportes%2FIEOD%2F2020%2F09%20Setiembre%2F07%2FAnexo1_Resumen_0709.xlsx". From the bold portion, it is clear that this is a GET method (the data included in the request is visible in the URL, which is not the case with POST). However, what parts of the request change, and what do the strange characters like %2F, %20, or %C3%B3 mean?
By reviewing the Network section of the Chrome Developer Tools, we can see that the query starts after download?url=.
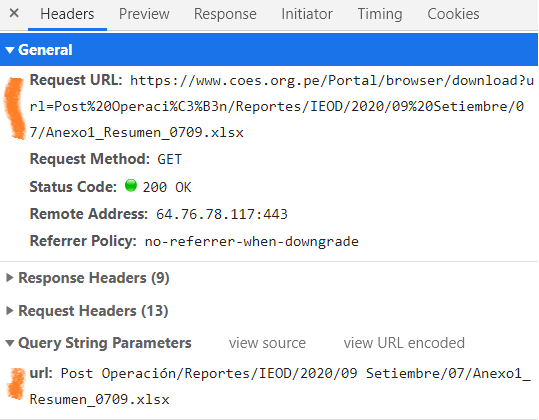
Figure 6: Figure 2
Based on the information above, we can infer that the GET portion carrying the data, i.e., the query, is:
*“Post Operación/Reportes/IEOD/2020/09 Setiembre/07/Anexo1_Resumen_**0709**.xlsx”*. Here’s what each bold element represents:
- Year (e.g., 2020)
- Month in numbers and letters (e.g., 09 Setiembre)
- Day number (e.g., 07)
- Day and month number combined (e.g., 0709)
If you click on view URL encoded, you will see that the encoded portion of the URL (Post%20Operaci%C3%B3n%2FReportes%2FIEOD%2F2020%2F09%20Setiembre%2F07%2FAnexo1_Resumen_0709.xlsx) translates as follows:
- %20 = space
- %C3%B3 = “ó” (accented letter)
- %2F = “/” (slash)
In conclusion, the IEOD data is downloaded using the GET method, with the date details included in the request and embedded in the URL.
Downloading in R
With the knowledge gained earlier, we are ready to automate the download process. First, I will create the download URL by selecting the desired date and then converting it into the GET syntax identified earlier.
To work with dates, I will use the Lubridate library. To avoid potential issues with the spelling of the month “September” (Setiembre?), I will use a different date in October instead.
library(lubridate)
library(lubridate)
fecha = as.Date("2023/10/07")
Sys.setlocale("LC_TIME", "es_ES")
## [1] "es_ES"
format <- "%a@%A@%b@%B@%p@"

library(lubridate)
path = paste("https://www.coes.org.pe/portal/browser/download?url=Post%20Operaci%C3%B3n%2FReportes%2FIEOD%2F",
               year(fecha), #El año
             "%2F", # dash (/)
             sprintf("%02d",month(fecha)), #número del mes, en 2 dígitos
             "_", #espacio
               str_to_title(month(fecha,label=TRUE,abbr = FALSE)), #mes en letras
             #How to put the output of month() in spanish?
             "%2F", # dash (/)
               sprintf("%02d",day(fecha)), #número del día en 2 dígitos
             "%2FAnexo1_Resumen_",
             sprintf("%02d",day(fecha)), #numero del dia
             sprintf("%02d",month(fecha)),#numero del mes
             ".xlsx",
             sep="") #concateno las partes en uno solo

path
## [1] "https://www.coes.org.pe/portal/browser/download?url=Post%20Operaci%C3%B3n%2FReportes%2FIEOD%2F2023%2F10_Octubre%2F07%2FAnexo1_Resumen_0710.xlsx"
https://www.coes.org.pe/portal/browser/download?url=Post%20Operaci%C3%B3n%2FReportes%2FIEOD%2F2023%2F10_Octubre%2F19%2FAnexo1_Resumen_1910.xlsx Next, I will verify that the link works and successfully downloads electricity demand by geographic zone as well as demand for large free users (mining and manufacturing).
Downloading Geographic Zone Data
library(openxlsx)
zonas = read.xlsx(path, sheet = "DEMANDA_AREAS", rows = c(12, 64), cols = c(5:7)) / 1000
zonas
##      NORTE   CENTRO      SUR
## 1 24.25947 94.15946 41.00531
As shown above, I downloaded the Excel file located at the path URL. From that Excel file, I selected the DEMANDA_AREAS sheet, which contains electricity demand in Peru, divided into three zones (North, Center, and South). From this sheet, I chose the columns (cols) containing demand by zone (columns 5 to 7). Additionally, I selected rows (rows) 12 (containing the column names) and 64 (containing the total daily consumption). Finally, I divided the values by 1,000 to convert the data from MWh to GWh.
Downloading Large Free Users Data (Mining and Manufacturing)
usuarios_libres = read.xlsx(path, sheet = "DEMANDA_UL", rows = c(20, 69))
duplicated_cols <- names(usuarios_libres)[duplicated(names(usuarios_libres))]
print(usuarios_libres)
##    X1 CEMENTOS.PACASMAYO CREDITEX INDUSTRIAL.PIURA MINERA.HORIZONTE-LLACUABAMBA
## 1 MWh           1019.079        0                0                            0
##   YANACOCHA BARRICK.-.PIERINA BARRICK-.ALTO.CHICAMA MISKIMAYO-BAYOBAR
## 1   681.969                 0                     0           279.545
##   GOLD.FIELD    MARSA SIDER.PERU TRUPAL AGROPECUARIA.AURORA
## 1   629.1684 301.3809   979.8908 241.25             312.375
##   PETROPERU.CL-6769.SE.GE1 PETROPERU.CL-6768.SE.GE1 ACEROS.AREQUIPA
## 1                  587.759                        0        1997.334
##   JOCKEY.PLAZA  ALICORP MINERA.ALPAYANA COMPAÑÍA.MINERA.CHUNGAR
## 1            0 229.4557        384.1315                337.6162
##   COMPAÑÍA.MINERA.CONDESTABLE CREDITEX.-.INDEPENDENCIA CREDITEX.-.INGENIEROS
## 1                      366.12                        0                     0
##   EL.BROCAL ADMINISTRADORA.CERRO KIMBERLY.CLARK.PERU LECHE.GLORIA MARCOBRE
## 1  817.9798             93.22284                   0            0 1153.913
##   MEPSA MINERA.ANTAMINA MINERA.BUENAVENTURA.(UCHUCHACUA+HUANCAVELICA) CHINALCO
## 1     0        3036.311                                        122.29 3607.068
##   MINERA.CORONA LOS.QUENUALES MINERA.SHOUXIN MINERA.VOLCAN MINSUR
## 1       131.204             0       324.9498      1141.029  67.78
##   NEXA.RESOURCES.CAJAMARQUILLA NEXA.RESOURCES.-.DESIERTO NEXA.RESOURCES.-.PASCO
## 1                     3910.832                    773.12               328.9331
##   OPP.FILM OXIDOS.PASCO PANASA SOFTYS.PERU QUIMPAC.-.PARAMONGA
## 1 76.87446     114.1832  104.4    278.3232            434.8822
##   QUIMPAC.-.OQUENDO REFINERIA.LA.PAMPILLA SHOUGANG.HIERRO.PERU
## 1          1050.251                480.05                    0
##   TEJIDOS.SAN.JACINTO TRUPAL.-.ZARATE UNACEM-ANDINO UNACEM-LIMA MARCOBRE
## 1             109.318        209.0815       666.175    731.5305 1153.913
##   ANGLO.AMERICAN.QUELLAVECO CAL.&.CEMENTO.SUR ANTAPACCAY HUDBAY.PERU
## 1                  1254.671          74.97723    2740.34           0
##   INDUSTRIAS.CACHIMAYO ARES-COTARUSE ARES-CALLALLI MINERA.BUENAVENTURA.-.ARES
## 1             442.9391      672.1465      18.83618                     160.93
##   MINERA.BUENAVENTURA.-.TAMBOMAYO CERRO.VERDE.(HIDROMETALÚRGICA)
## 1                         176.635                       610.3554
##   CERRO.VERDE.-.SULFUROS CERRO.VERDE.(AMPLIACIÓN) LAS_BAMBAS
## 1               3371.444                 6939.944   3678.651
##   MINSUR.-.SAN.RAFAEL MINSUR.-.PUCAMARCA     SPCC CEMENTOS.YURA
## 1            674.5289                  0 6634.635      800.1874
# Make column names unique
names(usuarios_libres) <- make.names(names(usuarios_libres), unique = TRUE)

# Proceed with select() or other operations
usuarios_libres <- usuarios_libres %>% select(-X1)

sample(usuarios_libres, size = 4) # Display 4 sample companies
##   SHOUGANG.HIERRO.PERU  ALICORP MINERA.BUENAVENTURA...ARES HUDBAY.PERU
## 1                    0 229.4557                     160.93           0
As shown above, I downloaded the Excel file located at the path URL. From that Excel file, I selected the DEMANDA_UL sheet, which contains the demand data for large free users. From this sheet, I chose rows (rows) 20 (which contains company names) and 69 (which contains the total daily consumption).
Data Cleaning
Cleaning the name of the variables:
nombres = names(usuarios_libres) #nombre de las variables
nombres = gsub("\\."," ",nombres) #cambio puntos por espacios
nombres[which(nombres=="CERRO VERDE HIDROMETALÚRGICA")] = "REFINERIA CERRO VERDE"
nombres[which(nombres=="VOTORANTIM METAIS CAJAMARQUILLA")] = "REFINERIA CAJAMARQUILLA"
nombres[which(nombres=="ANTAMINA+09 OCTUBRE ")] = "ANTAMINA"
nombres[which(nombres=="UNACEM-LIMA")] = "CEMENTOS LIMA"
nombres[which(nombres=="UNACEM-ANDINO")] = "CEMENTOS ANDINO"
nombres[which(nombres=="INCASAC")] = "CACHIMAYO"
nombres[which(nombres=="SPCC")] = "SOUTHERN PERU"
names(usuarios_libres) = nombres
nombres
##  [1] "CEMENTOS PACASMAYO"
##  [2] "CREDITEX"
##  [3] "INDUSTRIAL PIURA"
##  [4] "MINERA HORIZONTE LLACUABAMBA"
##  [5] "YANACOCHA"
##  [6] "BARRICK   PIERINA"
##  [7] "BARRICK  ALTO CHICAMA"
##  [8] "MISKIMAYO BAYOBAR"
##  [9] "GOLD FIELD"
## [10] "MARSA"
## [11] "SIDER PERU"
## [12] "TRUPAL"
## [13] "AGROPECUARIA AURORA"
## [14] "PETROPERU CL 6769 SE GE1"
## [15] "PETROPERU CL 6768 SE GE1"
## [16] "ACEROS AREQUIPA"
## [17] "JOCKEY PLAZA"
## [18] "ALICORP"
## [19] "MINERA ALPAYANA"
## [20] "COMPAÑÍA MINERA CHUNGAR"
## [21] "COMPAÑÍA MINERA CONDESTABLE"
## [22] "CREDITEX   INDEPENDENCIA"
## [23] "CREDITEX   INGENIEROS"
## [24] "EL BROCAL"
## [25] "ADMINISTRADORA CERRO"
## [26] "KIMBERLY CLARK PERU"
## [27] "LECHE GLORIA"
## [28] "MARCOBRE"
## [29] "MEPSA"
## [30] "MINERA ANTAMINA"
## [31] "MINERA BUENAVENTURA  UCHUCHACUA HUANCAVELICA "
## [32] "CHINALCO"
## [33] "MINERA CORONA"
## [34] "LOS QUENUALES"
## [35] "MINERA SHOUXIN"
## [36] "MINERA VOLCAN"
## [37] "MINSUR"
## [38] "NEXA RESOURCES CAJAMARQUILLA"
## [39] "NEXA RESOURCES   DESIERTO"
## [40] "NEXA RESOURCES   PASCO"
## [41] "OPP FILM"
## [42] "OXIDOS PASCO"
## [43] "PANASA"
## [44] "SOFTYS PERU"
## [45] "QUIMPAC   PARAMONGA"
## [46] "QUIMPAC   OQUENDO"
## [47] "REFINERIA LA PAMPILLA"
## [48] "SHOUGANG HIERRO PERU"
## [49] "TEJIDOS SAN JACINTO"
## [50] "TRUPAL   ZARATE"
## [51] "UNACEM ANDINO"
## [52] "UNACEM LIMA"
## [53] "MARCOBRE 1"
## [54] "ANGLO AMERICAN QUELLAVECO"
## [55] "CAL   CEMENTO SUR"
## [56] "ANTAPACCAY"
## [57] "HUDBAY PERU"
## [58] "INDUSTRIAS CACHIMAYO"
## [59] "ARES COTARUSE"
## [60] "ARES CALLALLI"
## [61] "MINERA BUENAVENTURA   ARES"
## [62] "MINERA BUENAVENTURA   TAMBOMAYO"
## [63] "CERRO VERDE  HIDROMETALÚRGICA "
## [64] "CERRO VERDE   SULFUROS"
## [65] "CERRO VERDE  AMPLIACIÓN "
## [66] "LAS_BAMBAS"
## [67] "MINSUR   SAN RAFAEL"
## [68] "MINSUR   PUCAMARCA"
## [69] "SOUTHERN PERU"
## [70] "CEMENTOS YURA"
The which function returns an index, which is the column number that satisfies the test (e.g., names == “X1”).
Some companies may have more than one measurement point. For instance, Cerro Verde has three: its old mine (Sulfuros), its mine expansion (Ampliación), and its hydrometallurgy center (Refinería). In this case, we sum the consumption of its old mine and the expansion, consolidating it into two measurement points (refinery and mine).
usuarios_libres = usuarios_libres %>%
  mutate("CERRO VERDE" = `CERRO VERDE   SULFUROS` + `CERRO VERDE  AMPLIACIÓN `,
         .after = `CERRO VERDE  AMPLIACIÓN `) %>%  # Sum two columns
  select(-`CERRO VERDE   SULFUROS`, -`CERRO VERDE  AMPLIACIÓN `) # Remove old columns
With the data from the major electricity-demanding companies (large free users), I can categorize them based on their economic activities. The main sectors where electricity consumption is closely tied to production are mining and manufacturing.
I already know which columns correspond to mining companies, so I will select only those.
minerias = usuarios_libres %>%
  select(1,2,4,5,6,9,11,12,17,20,24,25,27,28,30,31,32,33,34,35,38,40,41,42,43) # Select mining companies
names(minerias)
##  [1] "CEMENTOS PACASMAYO"
##  [2] "CREDITEX"
##  [3] "MINERA HORIZONTE LLACUABAMBA"
##  [4] "YANACOCHA"
##  [5] "BARRICK   PIERINA"
##  [6] "GOLD FIELD"
##  [7] "SIDER PERU"
##  [8] "TRUPAL"
##  [9] "JOCKEY PLAZA"
## [10] "COMPAÑÍA MINERA CHUNGAR"
## [11] "EL BROCAL"
## [12] "ADMINISTRADORA CERRO"
## [13] "LECHE GLORIA"
## [14] "MARCOBRE"
## [15] "MINERA ANTAMINA"
## [16] "MINERA BUENAVENTURA  UCHUCHACUA HUANCAVELICA "
## [17] "CHINALCO"
## [18] "MINERA CORONA"
## [19] "LOS QUENUALES"
## [20] "MINERA SHOUXIN"
## [21] "NEXA RESOURCES CAJAMARQUILLA"
## [22] "NEXA RESOURCES   PASCO"
## [23] "OPP FILM"
## [24] "OXIDOS PASCO"
## [25] "PANASA"
minerias %>%
  transmute(Minas_GWh = rowSums(.) / 1000) # Sum mining company data
##   Minas_GWh
## 1  17.71114
We can see that the mining companies consumed 2023-10-07 a total of 17.7 GWh.
Companies related to commerce/services, like Jockey Plaza Mall, do not have a strong relationship between production and electricity consumption, so they are excluded.
manufactureras = usuarios_libres %>%
  select(-names(minerias)) # Select manufacturers
names(manufactureras)
##  [1] "INDUSTRIAL PIURA"                "BARRICK  ALTO CHICAMA"
##  [3] "MISKIMAYO BAYOBAR"               "MARSA"
##  [5] "AGROPECUARIA AURORA"             "PETROPERU CL 6769 SE GE1"
##  [7] "PETROPERU CL 6768 SE GE1"        "ACEROS AREQUIPA"
##  [9] "ALICORP"                         "MINERA ALPAYANA"
## [11] "COMPAÑÍA MINERA CONDESTABLE"     "CREDITEX   INDEPENDENCIA"
## [13] "CREDITEX   INGENIEROS"           "KIMBERLY CLARK PERU"
## [15] "MEPSA"                           "MINERA VOLCAN"
## [17] "MINSUR"                          "NEXA RESOURCES   DESIERTO"
## [19] "SOFTYS PERU"                     "QUIMPAC   PARAMONGA"
## [21] "QUIMPAC   OQUENDO"               "REFINERIA LA PAMPILLA"
## [23] "SHOUGANG HIERRO PERU"            "TEJIDOS SAN JACINTO"
## [25] "TRUPAL   ZARATE"                 "UNACEM ANDINO"
## [27] "UNACEM LIMA"                     "MARCOBRE 1"
## [29] "ANGLO AMERICAN QUELLAVECO"       "CAL   CEMENTO SUR"
## [31] "ANTAPACCAY"                      "HUDBAY PERU"
## [33] "INDUSTRIAS CACHIMAYO"            "ARES COTARUSE"
## [35] "ARES CALLALLI"                   "MINERA BUENAVENTURA   ARES"
## [37] "MINERA BUENAVENTURA   TAMBOMAYO" "CERRO VERDE  HIDROMETALÚRGICA "
## [39] "CERRO VERDE"                     "LAS_BAMBAS"
## [41] "MINSUR   SAN RAFAEL"             "MINSUR   PUCAMARCA"
## [43] "SOUTHERN PERU"                   "CEMENTOS YURA"
manufactureras %>%
  transmute(Manufact_GWh = rowSums(.) / 1000) # Calculate consumption
##   Manufact_GWh
## 1     39.80477
We can see that the manufacturing companies consumed 2023-10-07 a total of 39.8 GWh.
Luis José Zapata Bobadilla
Economist - Analyst
Economist and advocate for innovative digital payment systems. Passionate about exploring monetary policy, blockchain technology, machine learning, and their transformative impact on the financial ecosystem.