Electricity for Economists II
Sources of Electricity Information in Peru
Sources of Information in Peru
COES
The COES manages the technical aspect of electricity flow (supply and demand) in the National Interconnected Electric System or SEIN. If you want to review the technical aspects of electricity, you can find them here.
As mentioned earlier, COES manages information on electricity generation, transmission, and demand in real time, ensuring the electrical system remains balanced (Supply = Demand).
COES also publishes this information on its website https://www.coes.org.pe/portal/.
There is a variety of information available on the COES website. Below, we will describe the most relevant aspects for our work:
Indicators of the Peruvian Energy Sector
This is the most accessible information on the COES website. There is a link on the homepage:
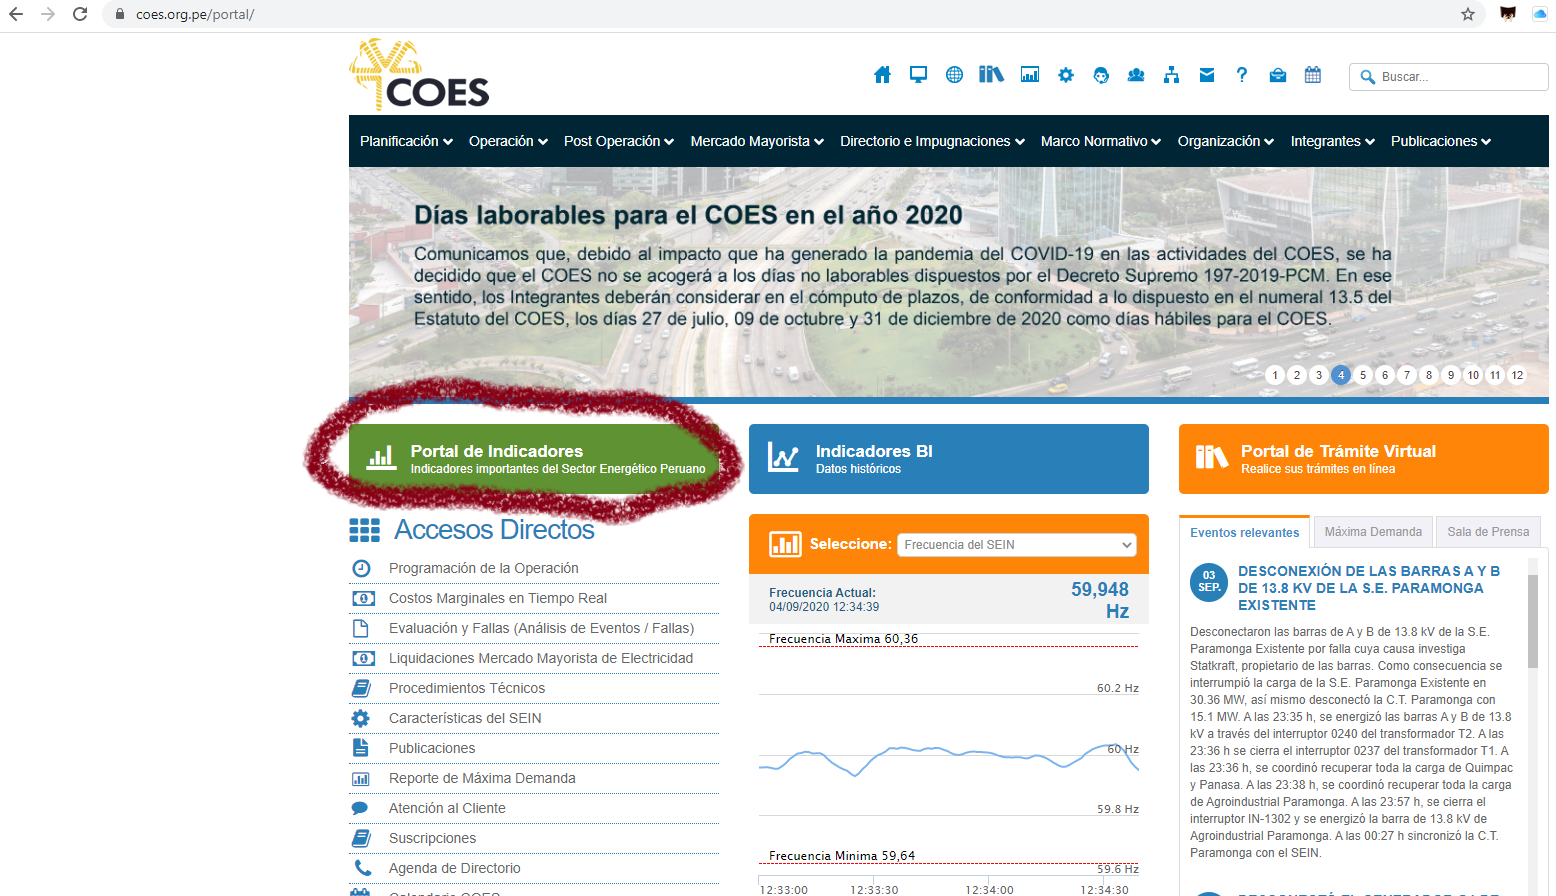
Figure 1: Indicador de generación total
This is the most accessible information on the COES website. There is a link on the homepage:
Figure 2: Total Generation Indicator
Here, we can access various information provided by agents in the electricity sector, such as:
- Electricity generation by all Peruvian generating companies within the SEIN.
- An estimate of electricity demand.
- Announcements of failures and repairs within SEIN.
- Information on the volume and capacity of hydroelectric company reservoirs.
The most relevant information for day-to-day economic analysis is electricity generation. Users can select a date range and view data on the website or download it as an Excel file. The website provides executed measurements every 30 minutes and projections for the rest of the current day. For dates prior to today, only executed data is available.
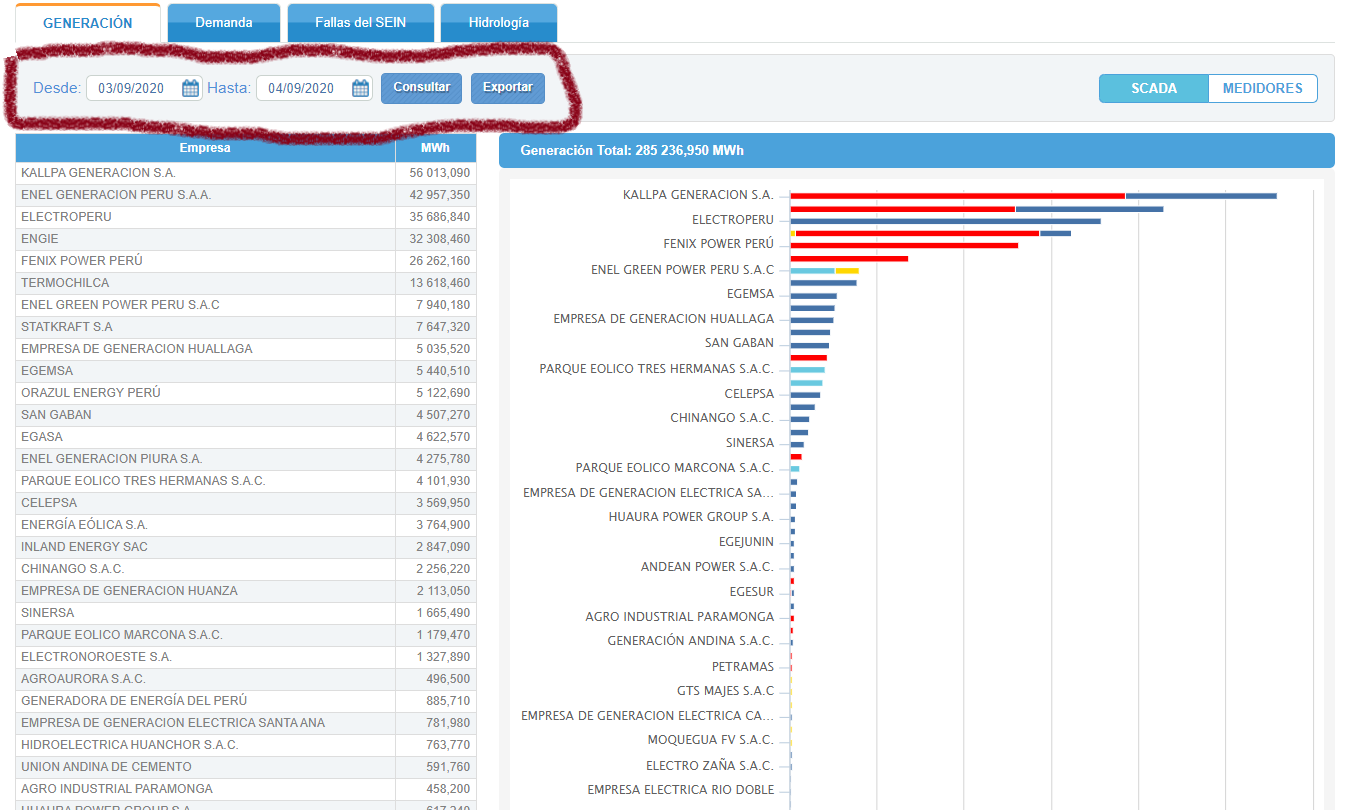
Figure 3: View Generation Data
Information is categorized by generating company and resource type (hydroelectric, gas, etc.).
Operations
Within the options available in the website’s top menu, we find various operation-related features of COES.

This section provides access to COES operation data, including the most important options::
Database
Database
Under the “Database” section, users can access automated data before it is published in official reports. The most relevant option for us is the Generation Meters:
- Generation Meters: Contains information on monthly electricity generation in the country, based on the selected date range. The most important data is Total Energy (MWh). The data for the previous month is uploaded on the third day of the month.
This section provides official data on the previous month’s electricity generation directly and before publication elsewhere.
Operation Program
The “Operation Program” section includes projections for future electricity demand and corresponding generation planning. The projections are more reliable when closer to the current date. For instance, daily projections are highly reliable, whereas weekly and medium-term projections are less so.
This information is not very relevant to our day-to-day work and does not need to be mastered; however, it can be useful to know for certain special requests.
Electricity demand can be mathematically divided into two parts: an almost invariant trend and a variable component that fluctuates according to the economic cycle. It is generally considered that the consumption of free users (industries, mines, etc.) constitutes the variable component, while the consumption of regulated users (households) represents the invariant trend. For medium-term projections, both free-user and regulated-user demand are calculated. The Vegetative Demand is the term commonly used to describe the trend component of electricity demand.
To project demand, COES calculates vegetative demand using an ARIMA model, while the variable component is obtained through a survey of all free users. This combined approach allows for medium-term projections.
To view this projection, click on Medium-Term Operation Program, select the date, and in the 2_Reports section, download the file PMPO_“Date”.zip. Within the zip file, extract another zip file Demand_“Date”.zip and open the Excel file **Medium-Term Demand Projection_ARIMA_“Date”.xlsx**. Inside, you will find the projection. However, it is important to note that the free-user data is only obtained through an annual survey, making the projection less reliable. Nonetheless, it is useful for planning investments in the electricity sector.
International Exchanges
The international exchanges section contains information on the import and export of electricity. The most relevant option within this section is Energy Meter Logs, which provides data on electricity imports and exports measured in MWh.
Electricity is transmitted in loads, which can be either positive or negative depending on the direction, i.e., whether the demand originates from one side or the other. This allows the load direction to be measured at substations located on the border.
Peru’s most significant international electricity exchange is with the neighboring country of Ecuador. This exchange is closely linked to the energy conditions in the northern region of Peru (demand or surplus energy), which is usually related to its economic activity.
Single-Line Diagram
Finally, the most relevant feature within the operations section is the single-line diagram. The single-line diagram is a map (in PDF format) that contains the name and location of each electricity measurement point within the SEIN.
The map allows us to observe electricity transmission lines, which are subdivided into smaller lines feeding smaller sectors. This way, if we have more granular information on regionally focused demand (Post-Operation - Agent Demand - Distributors), we can determine with certainty whether one measurement point includes the data of another point (i.e., if it is the “parent” of another line), avoiding overestimating demand when aggregating all information.
Post-Operation
Within the options available in the top menu of the website, we find various features, including the post-operation options of COES. This section contains information processed after passing through the Operation section. It allows access to more granular and processed data on national electricity demand.
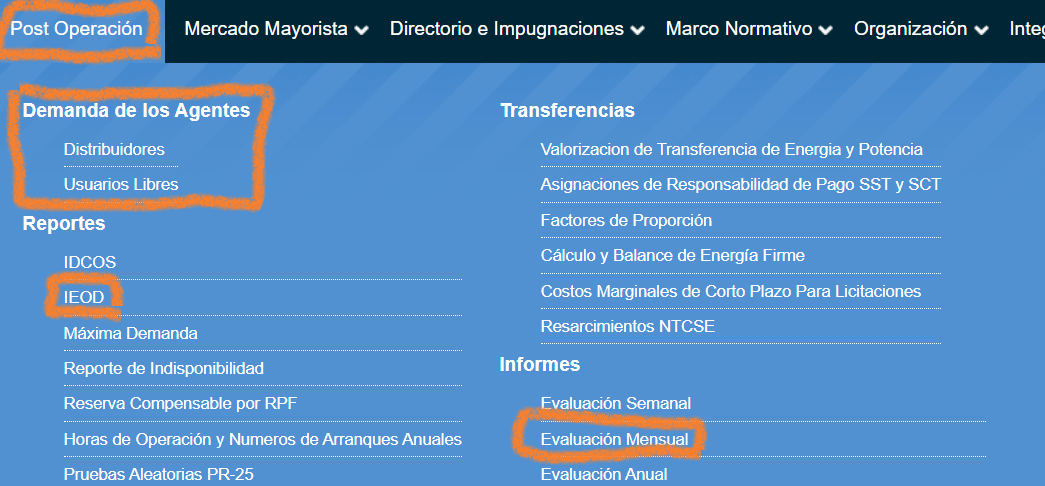
Figure 4: Post Operation
IEOD
The most important information we work with comes from the Daily Operation Evaluation Report (IEOD). This report contains all the detailed data from COES operations conducted on a specific day.
By accessing this section, we can select the desired date and download the most relevant Excel file: Anexo1_Resumen_“Date”.xlsx.
Part of the information divides the country into three regions: North, Center, and South, as shown in the following map:
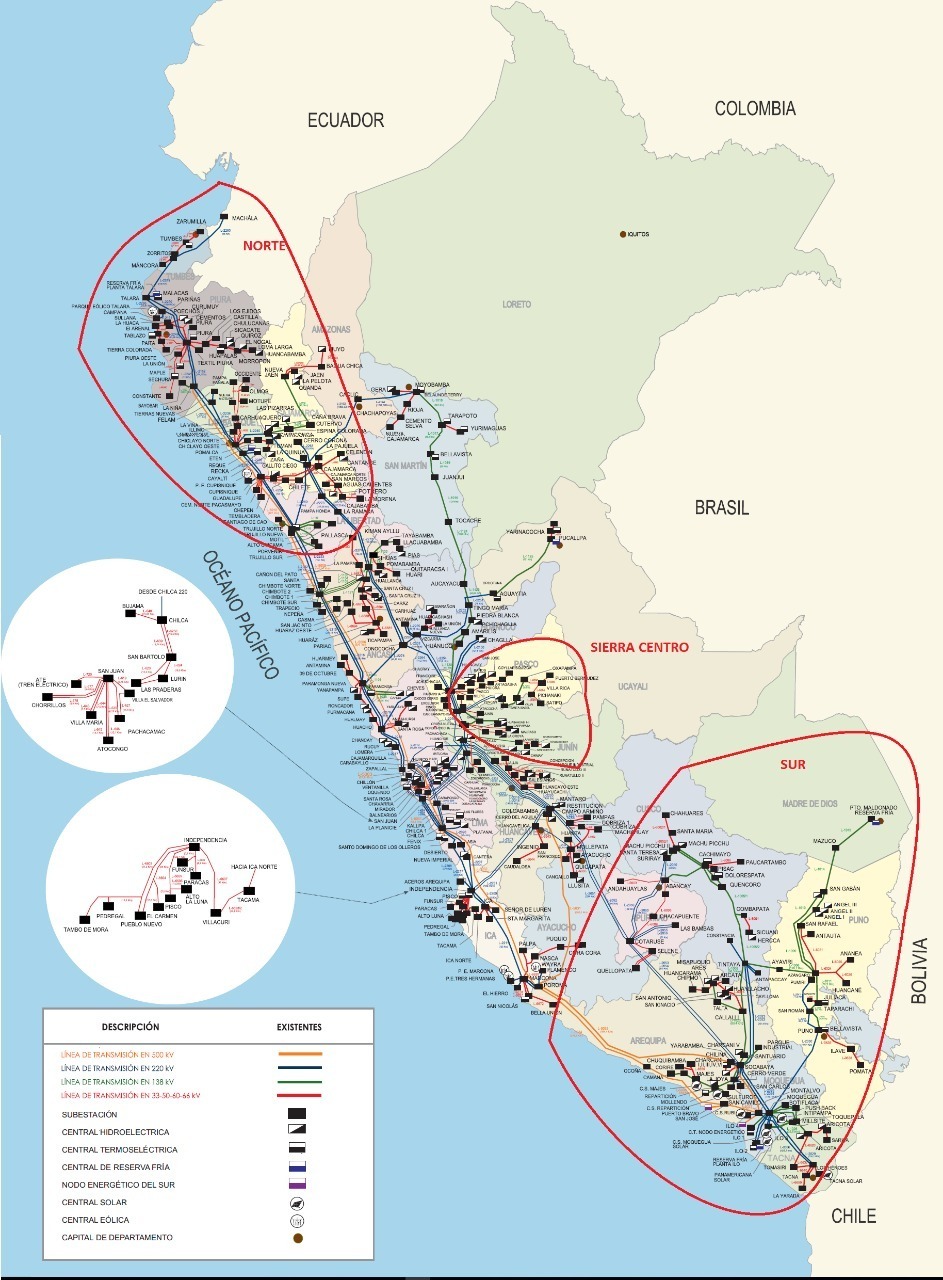
Figure 5: Diagrama unifilar
Within the IEOD Excel file, we find various useful sheets, the most relevant of which are:
- Demanda_UL: This sheet shows the power demand of Large Free Users (unlike free users [>2,500 KW], large free users are those demanding even more electricity [>10,000 KW]). The companies are categorized by their location in the North, Center, or South. Since the information is in power and provided every 30 minutes, to obtain the daily demand in GWh, the data must be summed, multiplied by 1,000, and divided by 2 (to convert the unit to 1 hour).
This data allows us to infer the demand of mining and manufacturing sectors. Companies are not legally obligated to provide this data (though there are monetary penalties), so the information may have gaps, represented by a demand of 0. Researchers must use their discretion to impute the missing data.
- Demanda_Areas: This sheet shows the total power demand in the country, separated by Areas and Sub-Areas. The most reliable data is by Areas (North, Center, and South). To calculate the daily data, the values recorded every 30 minutes are summed and then divided by 2. The total corresponds to the energy observed by COES-affiliated companies, so it is slightly less than the total demand measured in SEIN (Indicators of the Peruvian Energy Sector).
These two sheets are the most relevant. However, the Excel file also includes information on generation by resource (hydroelectric, natural gas, etc.), which can be useful depending on the researcher’s needs.
Reports - Evaluation
This section displays the reports prepared by COES for the public. The most relevant report is the Monthly Report, which provides the official data on generation and the percentage variation for a given month. The monthly data does not match the sum of the daily data collected due to measurement errors.
The report is published on the 15th of each month. However, the official monthly generation data can be accessed earlier in the Operations -> Database section.
Agent Demand
This section shows the demand of two COES agents: Free Users and Distribution Companies:
Free Users: Displays the demand of some free users affiliated with COES. Each month, some free users voluntarily provide their daily demand data to COES, while others opt out, making this information variable. Compared to the IEOD, this section includes data from more companies and is subdivided by each company’s measurement points (e.g., each factory).
Distribution Companies: Shows the electrical demand in the region assigned to each distribution company. A measurement point may include data from another measurement point, which is why it’s important to review the Single-Line Diagram to ensure the information is consistent. The most relevant data in this section comes from higher-level measurement points (e.g., substations in the regional capital). To locate these, it is also useful to consult the single-line diagram. This information is somewhat complex to process and relatively new, so I conducted an analysis here.
Distribution companies are often state-owned and inefficient, so the data is variable and unreliable. This information is still being implemented and is not available for all districts. However, COES is working to ensure that, in the future, each distribution company will automatically report its demand data.
Members
Finally, another option in the top menu is “Members.” By clicking on “List of Members”, we can view the members of COES, whether they are Generators, Distributors, or Free Users.
Additionally, COES responds to any inquiries we may have. This is useful, for example, if we suspect a data error. To contact them, simply click on the blue button located at the top, labeled “Contact Us” when you hover over it.
OSINERGMIN
OSINERGMIN is the entity responsible for overseeing the members of COES. An interesting feature is the SEIN map, which contains the geographic location of SEIN components: https://www.osinergmin.gob.pe/newweb/uploads/Publico/MapaSEIN/.
Additionally, it is possible to access information on the demand of all free users in the country through the following link, under Publications -> Monthly Reports -> Free Electricity Market:
However, this information is delayed by 2 months, making it less useful for recent data needs.
MINISTRY OF ENERGY AND MINES
Finally, the Ministry of Energy and Mines also conducts an annual review of the electricity sector. Their reports are delayed by 1 or 2 years but contain a wealth of historical information, such as the total demand in the country by industrial activity.
The information can be downloaded from: http://www.minem.gob.pe/_estadisticaSector.php?idSector=6
Luis José Zapata Bobadilla
Economist - Analyst
Economist and advocate for innovative digital payment systems. Passionate about exploring monetary policy, blockchain technology, machine learning, and their transformative impact on the financial ecosystem.